ACRE Shelter Dashboard
Are you looking for a one-stop shop to view all your shelter-related data in one place? ACRE Consulting's Shelter Dashboard for Power BI does everything you want and more!
Dashboard highlights:
- Slicers for cluster, service provider type, service provider, program type, program, country, province, city, and date range
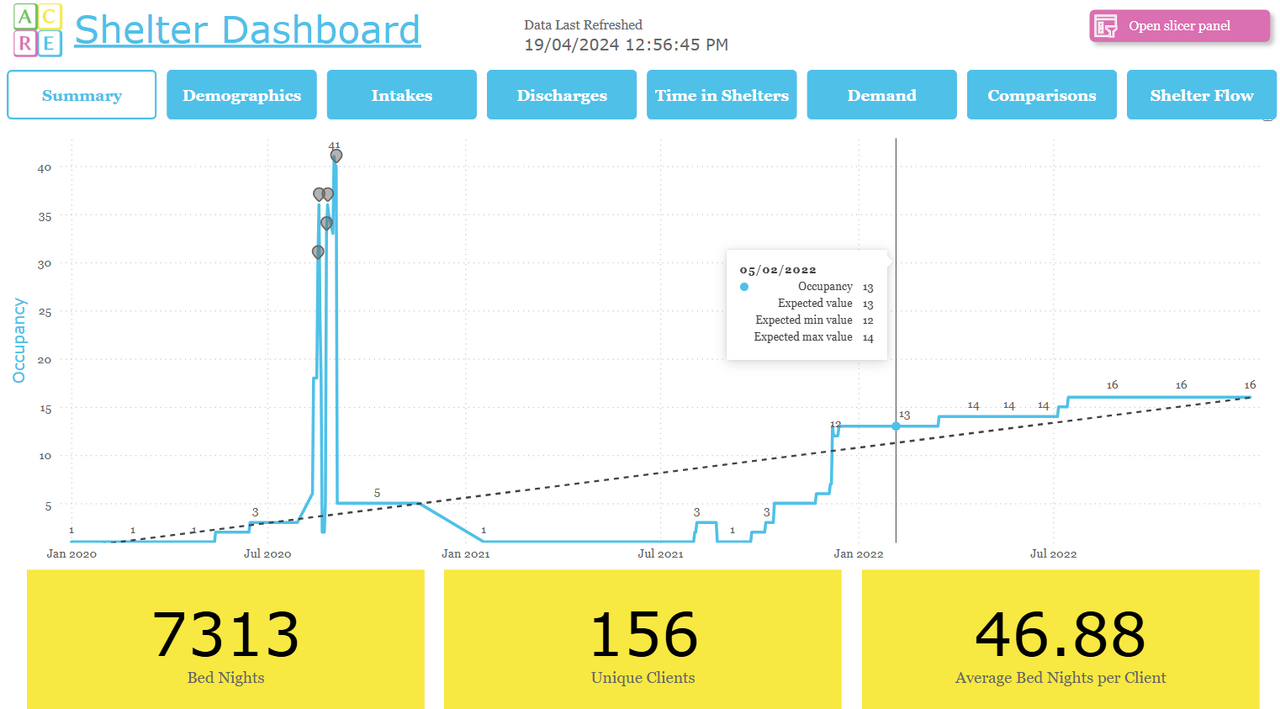
- A dynamic graph showing occupancy by date, with trends and anomalies detected
- Demographic breakdowns by gender, age, citizenship, veteran status, and indigenous identity
- An intakes page showing reason for service, origin city, origin housing type, and housing status at intake, along with a bonus slicer for intake number
- A discharges page showing reason for discharge, destination city, destination housing type, and housing status at discharge
- A flow-through chart showing how many clients went from homeless at intake to housed at discharge, or use other parameters to look at origin and destination city or housing type
- An analysis of the duration clients are spending in shelters
- Shelter demand analysis, including data from turnaways and active service restrictions
- The ability to cross-tabulate your data on nine different dimensions, such as by looking at year-over-year or month-over-month changes, comparing different programs or service providers, or grouping data by city or cluster
Go for a Test Drive
Frequently Asked Questions
Do I need any software to use this dashboard?
Yes. You need a copy of Microsoft Power BI, or you won't be able to do anything with the file you download.
What version of HIFIS is required to use this dashboard?
This report should run on any version of HIFIS version 4.0.57 and higher. Bonus: if you are using 4.0.60+, it will pull some data about Diversions. It's a minimal amount of information to ensure compatibility with all versions of HIFIS.
What happens if the dashboard stops working?
This dashboard will be maintained into the foreseeable future. If a software update causes it to stop working, or if we find an error, we'll update the file and let you know there's a new version available, at no additional cost to you.
How long does this dashboard take to pull data?
It depends on how much data is in your database, but unfortunately the answer is "pretty long." It pulls data about every client's attendance in a group activity in your database. Most likely, the best use for this dashboard is to refresh it once a week.
Does this dashboard import data or use direct query?
Import. One of the reasons for this is because it is pulling and manipulating a large amount of data, and it takes a long time to compile it all.
Does this dashboard use any native queries?
Yes. It simply wasn't possible to build this dashboard without using one.
How do I connect this dashboard to my data?
Check out our README file.
You may also like...
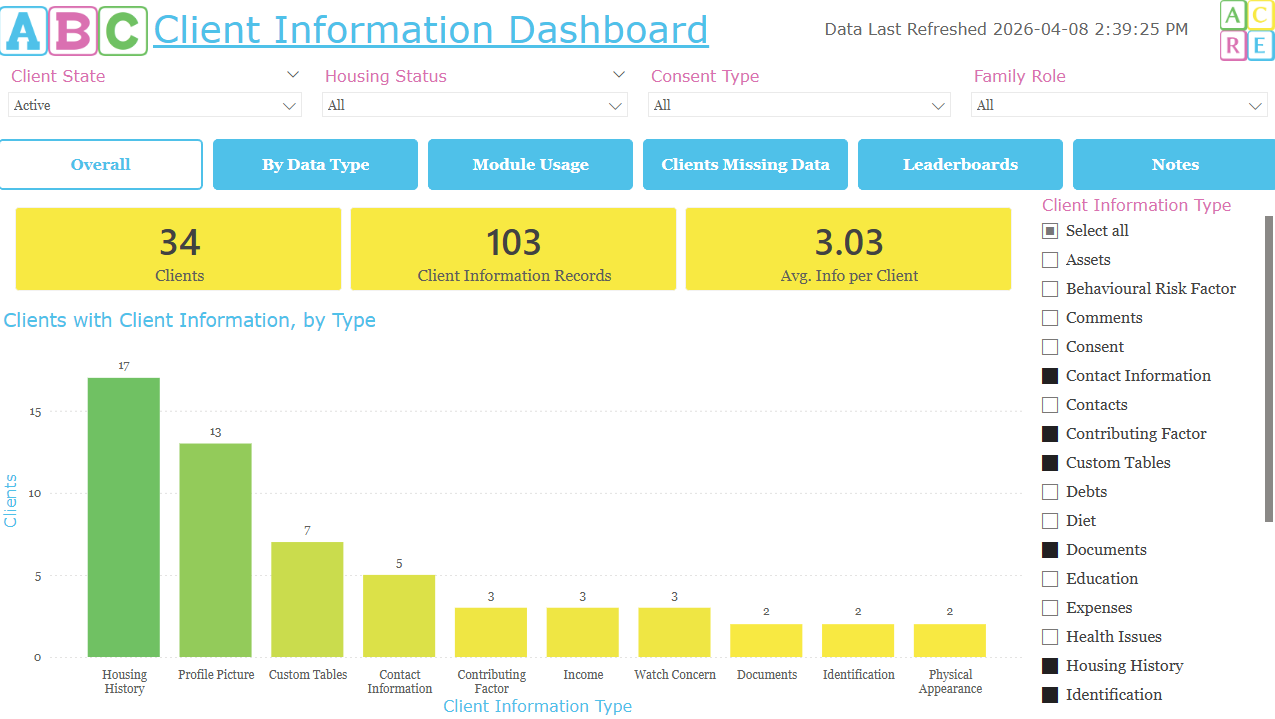
This interactive dashboard allows you to review your Client Information for completeness and usage, allowing you to see overall, how many of your clients have data; which service providers and users are the most consistent at adding data; a list of which clients have the most data gaps; and review a leaderboard of top performing staff and service providers.
This interactive dashboard allows you to review your Client Information for completeness and usage, allowing you to see overall, how many of your clients have data; which service providers and users a…
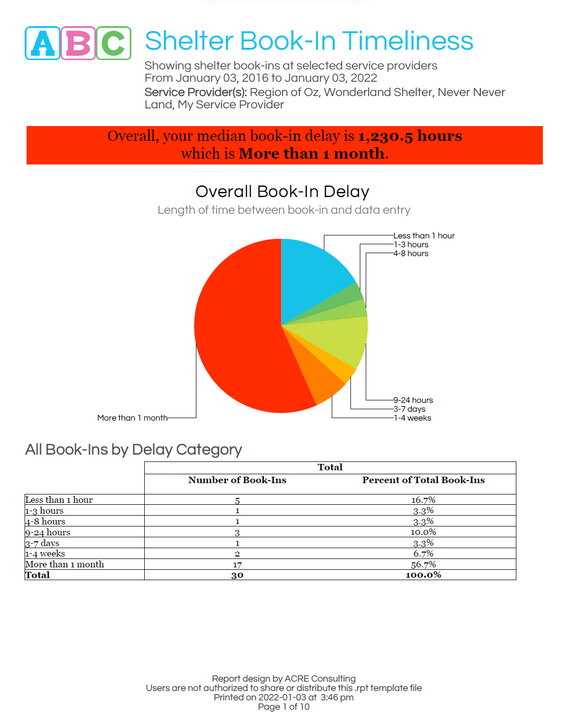
This report contains everything a community or service provider needs to conduct a data quality timeliness audit for their shelter book-ins. It measures the gap between actual book-in time and data entry time.
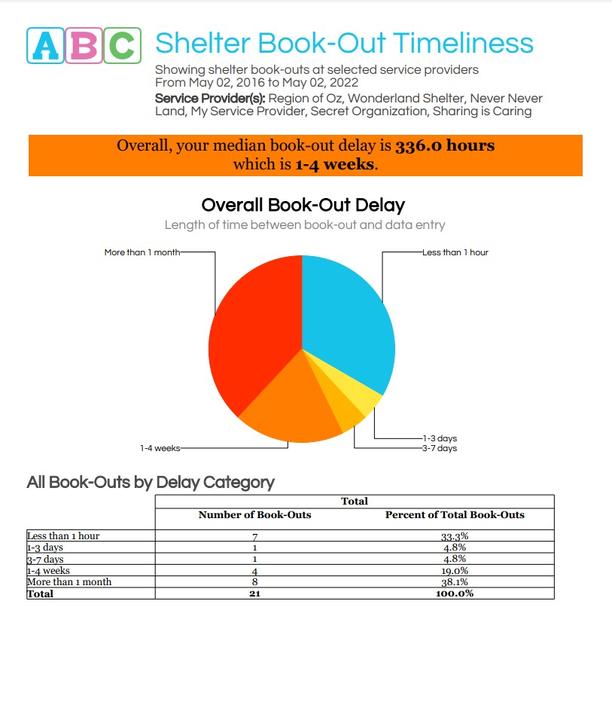
This report contains everything a community or service provider needs to conduct a data quality timeliness audit for their shelter book-outs. It measures the gap between actual book-out time and data entry time.

Review your Group Activities data in the dynamic, interactive Drop-in Dashboard for Power BI. This dashboard is ideal for drop-in programs, but can be used for any program making use of Group Activities.