ACRE Drop-In Dashboard

Review your Group Activities data in the dynamic, interactive Drop-in Dashboard for Power BI. This dashboard is ideal for drop-in programs, but can be used for any program making use of Group Activities.
Dashboard highlights:
- Slicers for service provider type, service provider, program type, program, date range, group activity type, reason for service, group activity size, attendance, location, and more!
- Key performance indicators showing total number of events, total number of attendees, number of visits per client, and breakdown by known/unknown attendees
- A handy calendar showing a monthly/weekly/yearly view of all of your group activities by date
- A full demographic breakdown for known clients and unknown clients, on the basis of indigenous identity, gender, age, citizenship, and veteran status
- A breakdown and analysis by housing status, including a reminder to collect housing status for group activity attendees
- Breakdown of number of events and number of attendees by group activity type, location, reason for service, referral locations, service provider, service provider type, and program
- A trend analysis showing changes in attendance over time, allowing you to see if demand is increasing, decreasing, or remaining stable
Go for a Test Drive
Frequently Asked Questions
Do I need any software to use this dashboard?
Yes. You need a copy of Microsoft Power BI, or you won't be able to do anything with the file you download.
What version of HIFIS is required to use this dashboard?
This report should run on any version of HIFIS version 4.0.59 and higher.
What happens if the dashboard stops working?
This dashboard will be maintained into the foreseeable future. If a software update causes it to stop working, or if we find an error, we'll update the file and let you know there's a new version available, at no additional cost to you.
How does this dashboard refresh?
This report uses import mode, which means that it's pulling data periodically from your dashboard and you get to play with a local copy of it. You'll need to set up Power BI Service to create a refresh schedule. See our README file for more details.
Does this dashboard use any native queries?
No
Does this dashboard use any custom views?
Yes, which are included in the purchase price of this file. This report includes:
How do I connect this dashboard to my data?
Check out our README file.
You may also like...
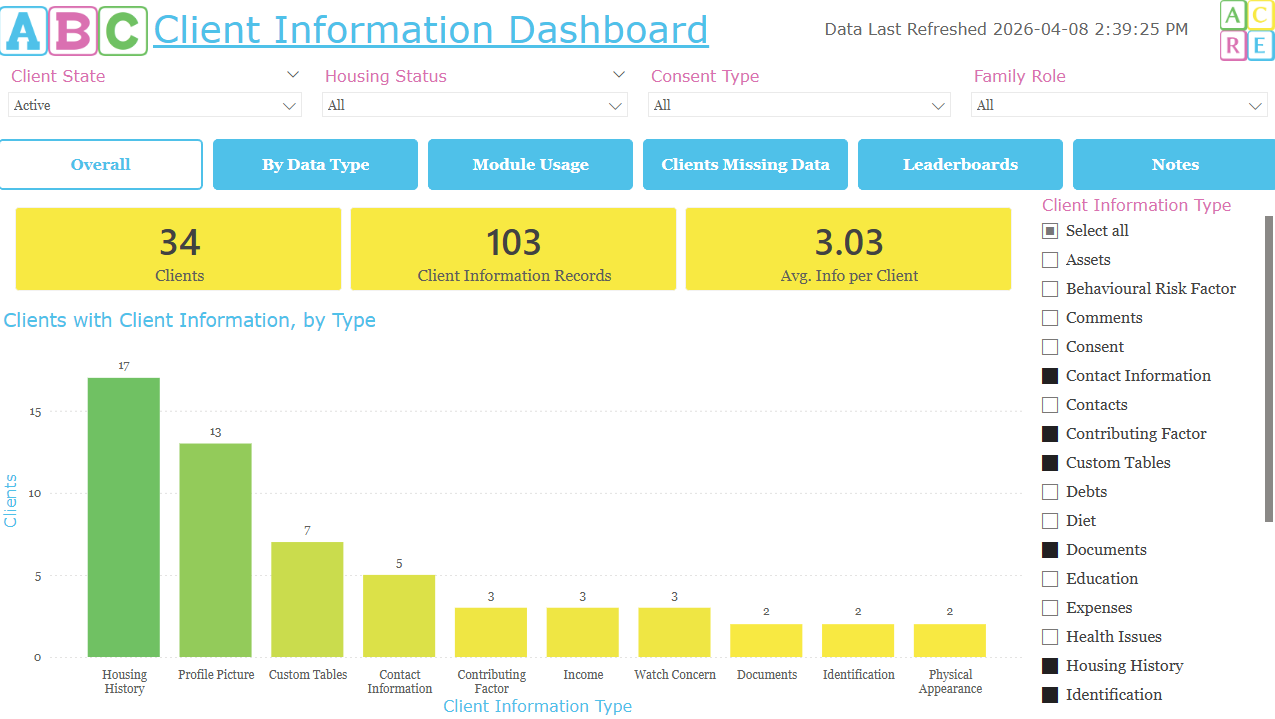
This interactive dashboard allows you to review your Client Information for completeness and usage, allowing you to see overall, how many of your clients have data; which service providers and users are the most consistent at adding data; a list of which clients have the most data gaps; and review a leaderboard of top performing staff and service providers.
This interactive dashboard allows you to review your Client Information for completeness and usage, allowing you to see overall, how many of your clients have data; which service providers and users a…
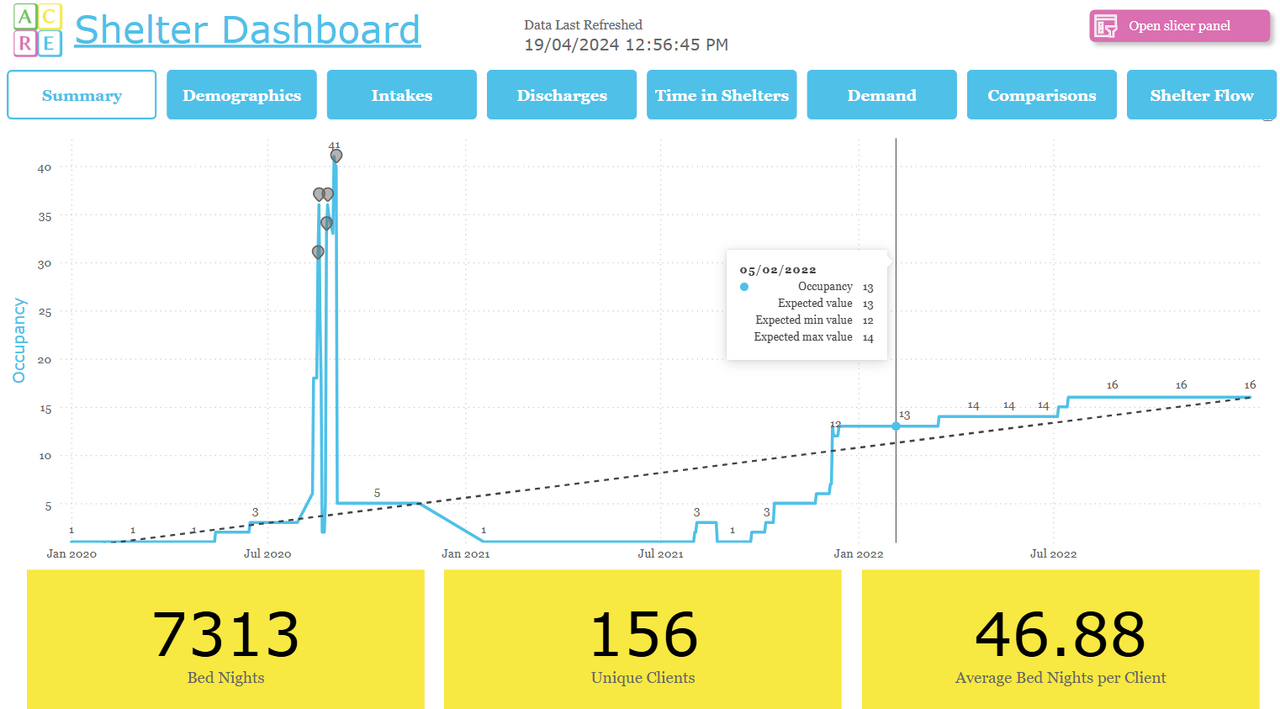
Are you looking for a one-stop shop to view all your shelter-related data in one place? ACRE Consulting's Shelter Dashboard for Power BI does everything you want and more!
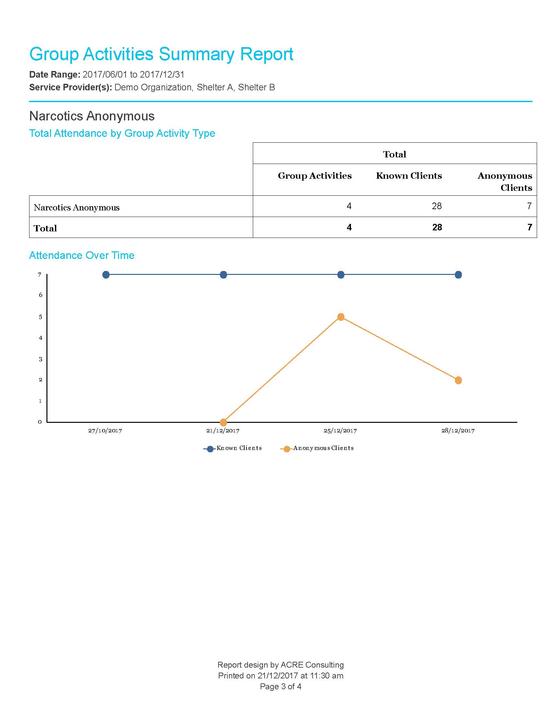
This report aggregates data for group activities in a specified date range at specified Service Providers. It sorts by type of group activity, and displays group activity attendance trends over time.


This view compiles all the relevant information about each group activity, including aggregated information about the number of attendees, but does not include information about the attendees themselves.
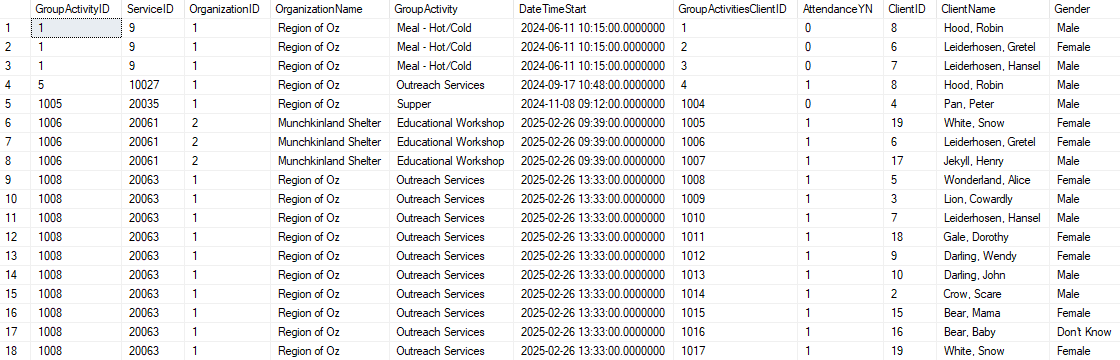
This view compiles relevant information about each group activity with a record for each attendee.