ACRE Outreach Dashboard
View your encampment and outreach service data all in one place on ACRE Consulting's Outreach Dashboard for Power BI.
Dashboard highlights:
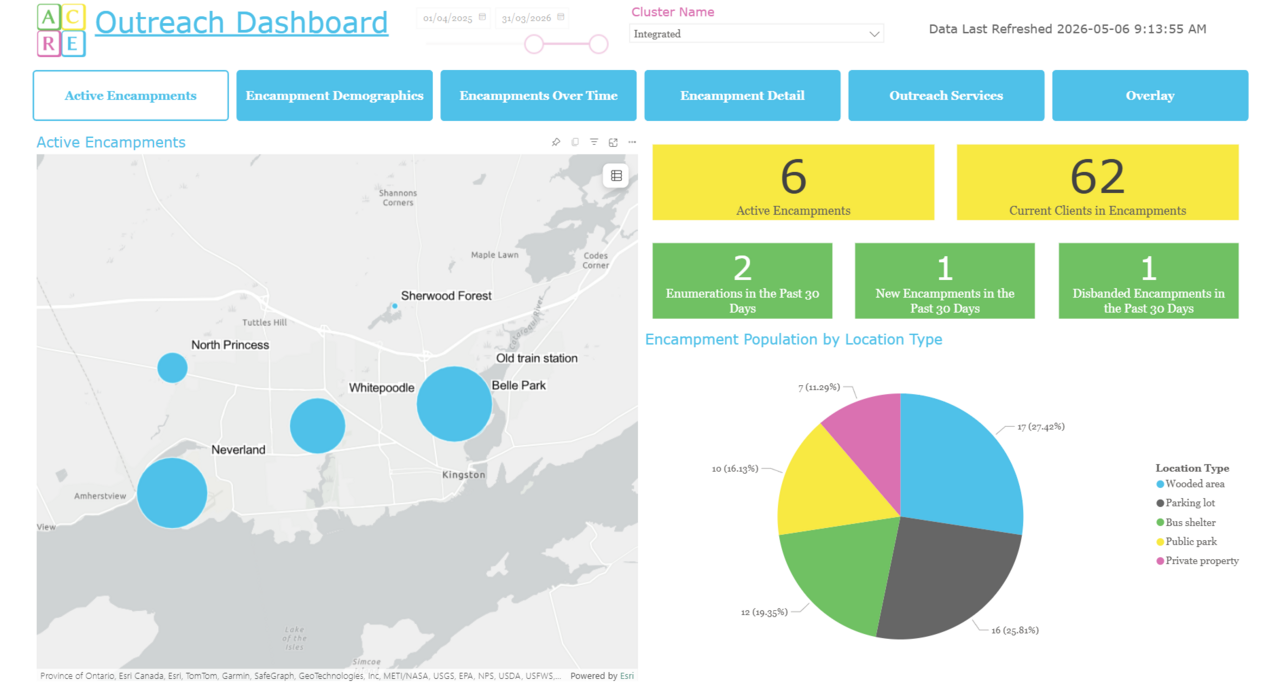
- Landing page featuring current count of distinct encampments, count of total clients recently counted in encampments, and recent activity in the past 30 days
- Visualize encampments geographically across your service area by location type and population size
- Use the date slicers to see changing encampment populations over time
- Compare demographics of clients in encampments against the demographics of those not in encampments
- Intelligent analysis showing the key demographic features of your encampment population
- See row-level data about encampments, filtered by cluster, date range, encampment name, location type, caseworker, and reason disbanded
- Plot outreach services on a map. Analyze and filter by service type, activity type, reason for service, referral information, and service provider.
- Are your outreach services targeted to where the clients are? Overlay your encampment locations and your geographic services in the same visual!
- Use ArcGIS or Azure Maps to render your maps
Go for a Test Drive
Frequently Asked Questions
Do I need any software to use this dashboard?
Yes. You need a copy of Microsoft Power BI, or you won't be able to do anything with the file you download.
How does the mapping work? Why are there multiple versions?
There are a few different versions of this report.
One version uses ArcGIS. It works internally, but if you want to publish your dashboard online, you will need a paid ArcGIS account.
A second version uses Azure Maps, which requires Azure Maps to be enabled in your Power BI settings.
You get access to both versions. Pick whichever one your organization is more willing to support.
What version of HIFIS is required to use this dashboard?
This report should run on version of HIFIS version 4.0.65.5 and higher.
What happens if the dashboard stops working?
This dashboard will be maintained into the foreseeable future. If a software update causes it to stop working, or if we find an error, we'll update the file and let you know there's a new version available, at no additional cost to you.
Does this dashboard import data or use direct query?
Import. One of the reasons for this is because it is pulling and manipulating a large amount of data, and it takes a long time to compile it all.
How do I connect this dashboard to my data?
Check out our README file.
You may also like...
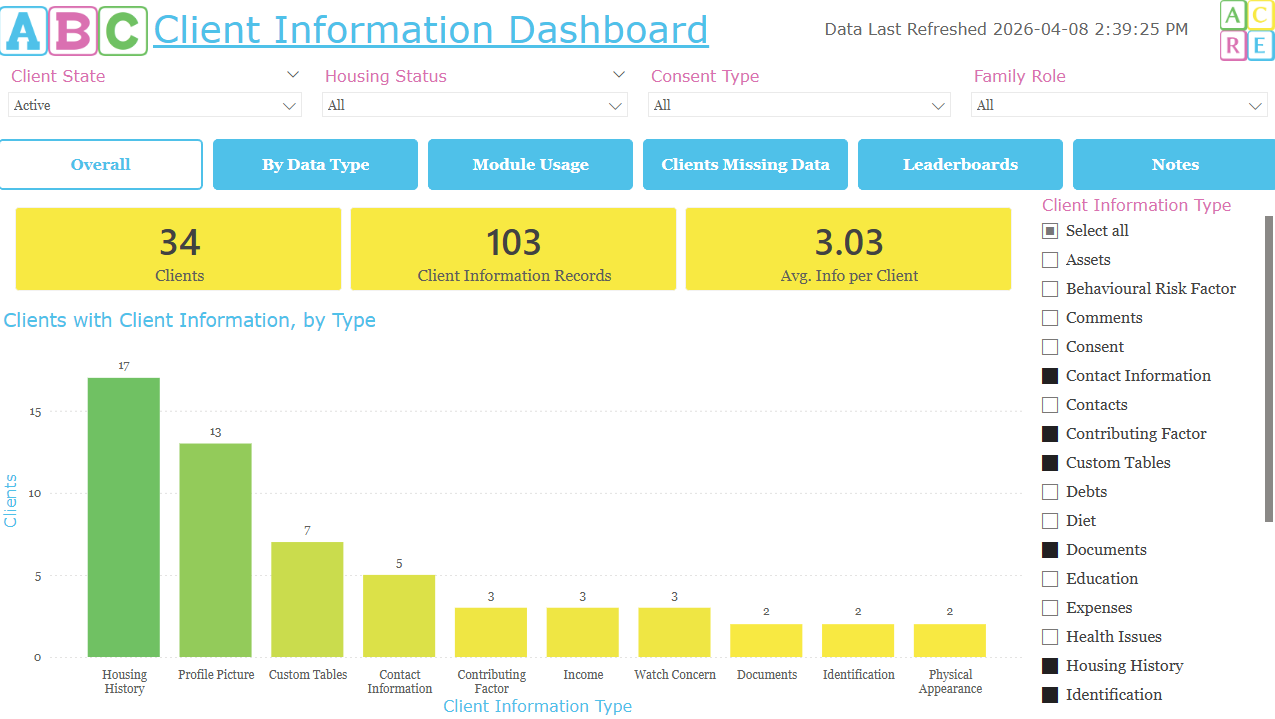
This interactive dashboard allows you to review your Client Information for completeness and usage, allowing you to see overall, how many of your clients have data; which service providers and users are the most consistent at adding data; a list of which clients have the most data gaps; and review a leaderboard of top performing staff and service providers.
This interactive dashboard allows you to review your Client Information for completeness and usage, allowing you to see overall, how many of your clients have data; which service providers and users a…

Review your Group Activities data in the dynamic, interactive Drop-in Dashboard for Power BI. This dashboard is ideal for drop-in programs, but can be used for any program making use of Group Activities.
View your encampment and outreach service data all in one place on ACRE Consulting's Outreach Dashboard for Power BI.
View your encampment and outreach service data all in one place on ACRE Consulting's Outreach Dashboard for Power BI.